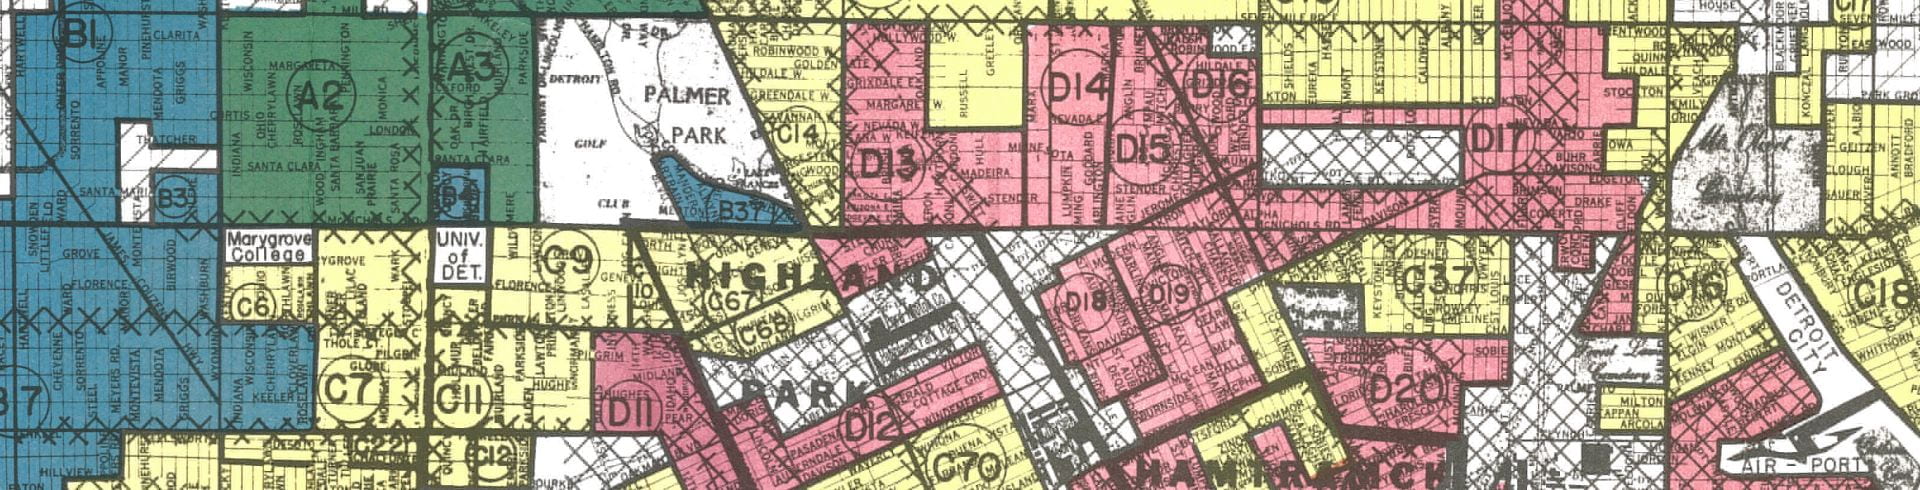
Detail from 1940 redlining map of Detroit (from Mapping Inequality)
For most of its history, Blacks and non-Whites represented less than one percent of Detroit’s population. After World War I, the industrial powerhouse of Detroit started shifting. New restrictions in immigration law cut the flow of European immigrant labor to America. Some northern urban employers looked instead to recruit cheap Black labor from the rural American south. At the same time, the mechanization of farm labor in the American south combined with threats of racial violence drove Blacks from rural farms to northern cities. Six million made the trip north from the 1910s through 1950s.
Their arrival in cities like Detroit immediately made the White majority scared. Cities like Detroit needed and profited from Black bodies without wanting to live with Black people. Systems were set to lock Blacks in place. One group called the Federal Housing Administration (FHA) created maps telling banks where to invest, who to sell homes to, and who to refuse. This practice cut up Detroit, denied investment to all the Black neighborhoods, even neighborhoods that had few Blacks. This practice is called redlining. It created a template for decline that still effects today communities that were redlined a century ago.
The exhibit breaks new ground by showing how the redlined areas were identified, mapped, and impacted. The mapping programs will be shown on interactive touch screens. Visitors will be able to find their street and neighborhood, and then to track through interactive maps the impact on them of redlining and subsequent policies. This part of the exhibit also records the Black-owned banks and other organizations that attempted to fight redlining.
View project full screen
Data Sources
Topoview from USGS for street network maps
Mapping Inequality Projecct for redlining data
IPUMS at the University of Minnesota for population and race by census tract